30 USDT / mo
1 pair · 30 USDT per pair
- Daily-candle signals
- 1 private channel
- Instant alerts
- 30-day access
Crypto signal system · daily candles
Every signal here compiles from code: same rules, same execution, zero improvisation. The edge is statistical: a proprietary TradingView indicator with three years of data published month by month — losing months included. No crystal ball: statistics, asymmetry, and a fixed −2.1% stop on every single trade.
Real-time verification
We stream the indicator trading on 5-minute candles, in real time, unedited. That is the demo: lots of signals, lots of noise, everything in plain sight. What we sell is different — the daily-candle signals: same logic, far more selective entries.
Technical note: replace YOUR_CHANNEL_ID in the code with your YouTube channel ID to enable the embedded stream.
Full track record · 2024 → 2026
Real screenshots of the indicator on TradingView (daily candles) with its monthly win/loss tables. Past performance does not guarantee future results — which is exactly why we also publish the losing months. No year closed in the red over the last three years; several months did, and they are right here.
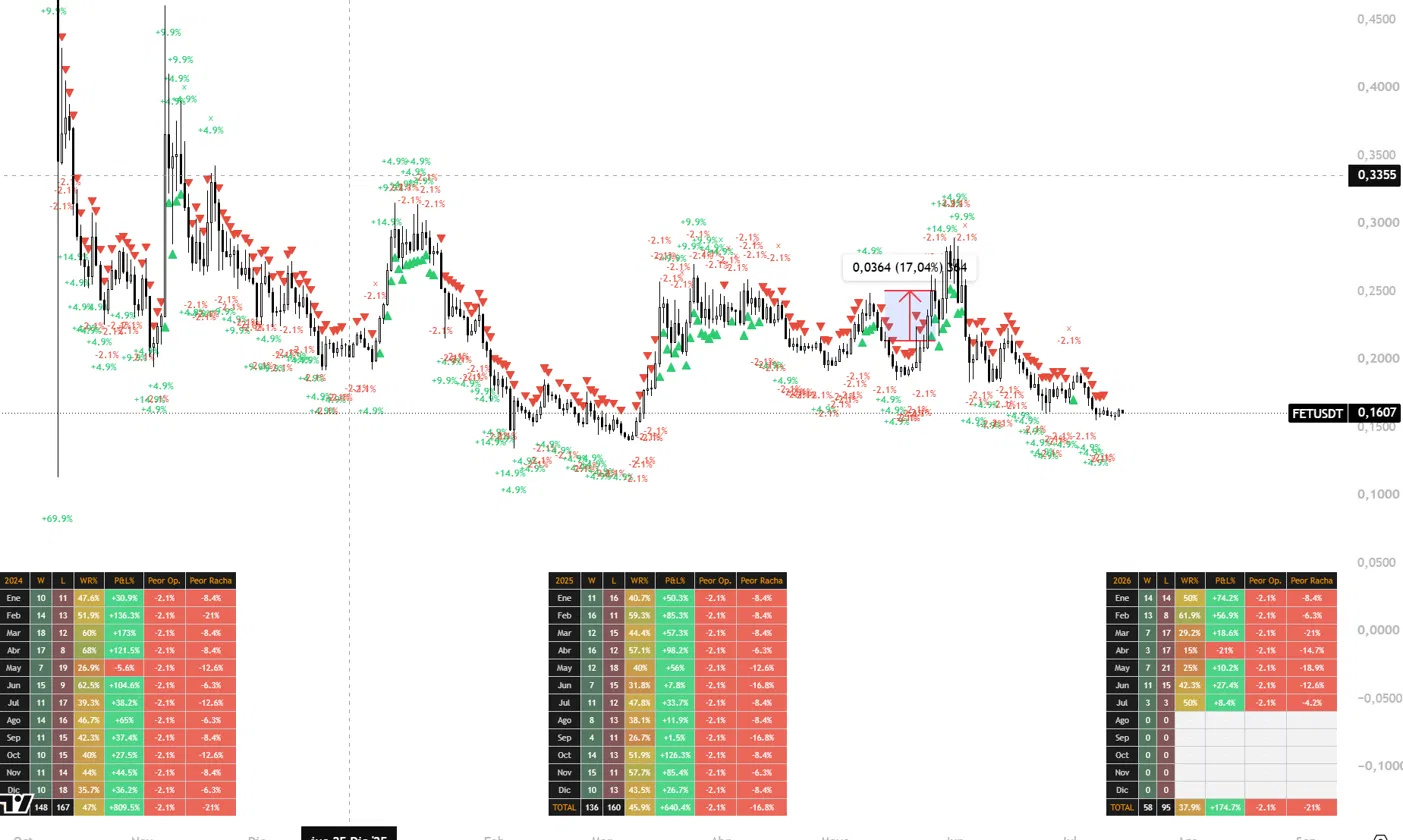
FETUSDT · TradingView indicator screenshot · click to enlarge
| Year | Trades | W − L | Win rate | Cum. P&L | Worst streak |
|---|---|---|---|---|---|
| 2024 | 315 | 148 − 167 | 47.0% | +809.5% | −21.0% |
| 2025 | 296 | 136 − 160 | 45.9% | +640.4% | −16.8% |
| 2026* | 153 | 58 − 95 | 37.9% | +174.7% | −21.0% |
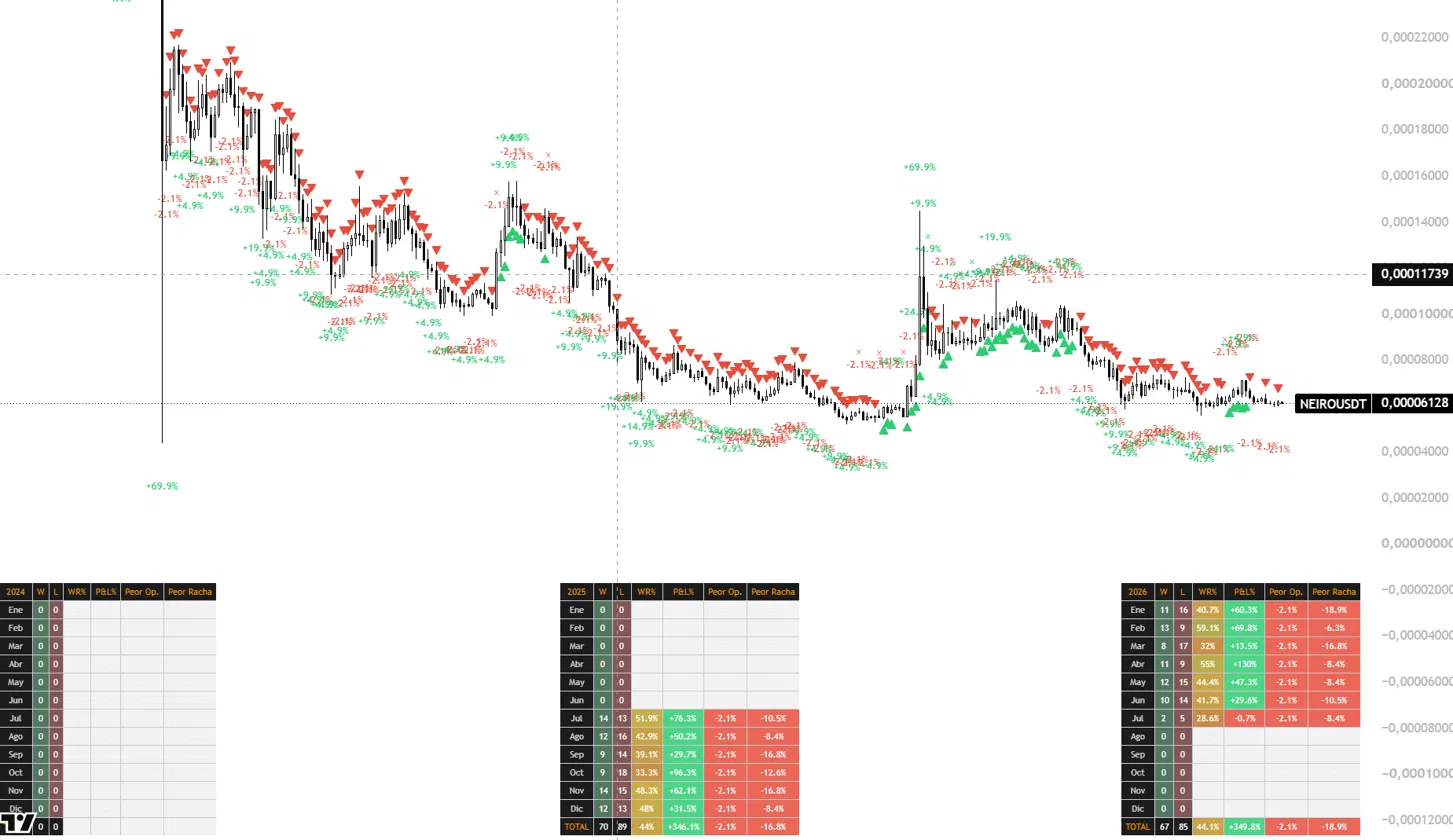
NEIROUSDT · TradingView indicator screenshot · click to enlarge
| Year | Trades | W − L | Win rate | Cum. P&L | Worst streak |
|---|---|---|---|---|---|
| 2025† | 159 | 70 − 89 | 44.0% | +346.1% | −16.8% |
| 2026* | 152 | 67 − 85 | 44.1% | +349.8% | −18.9% |
† Track record since July 2025 (pair listing date).
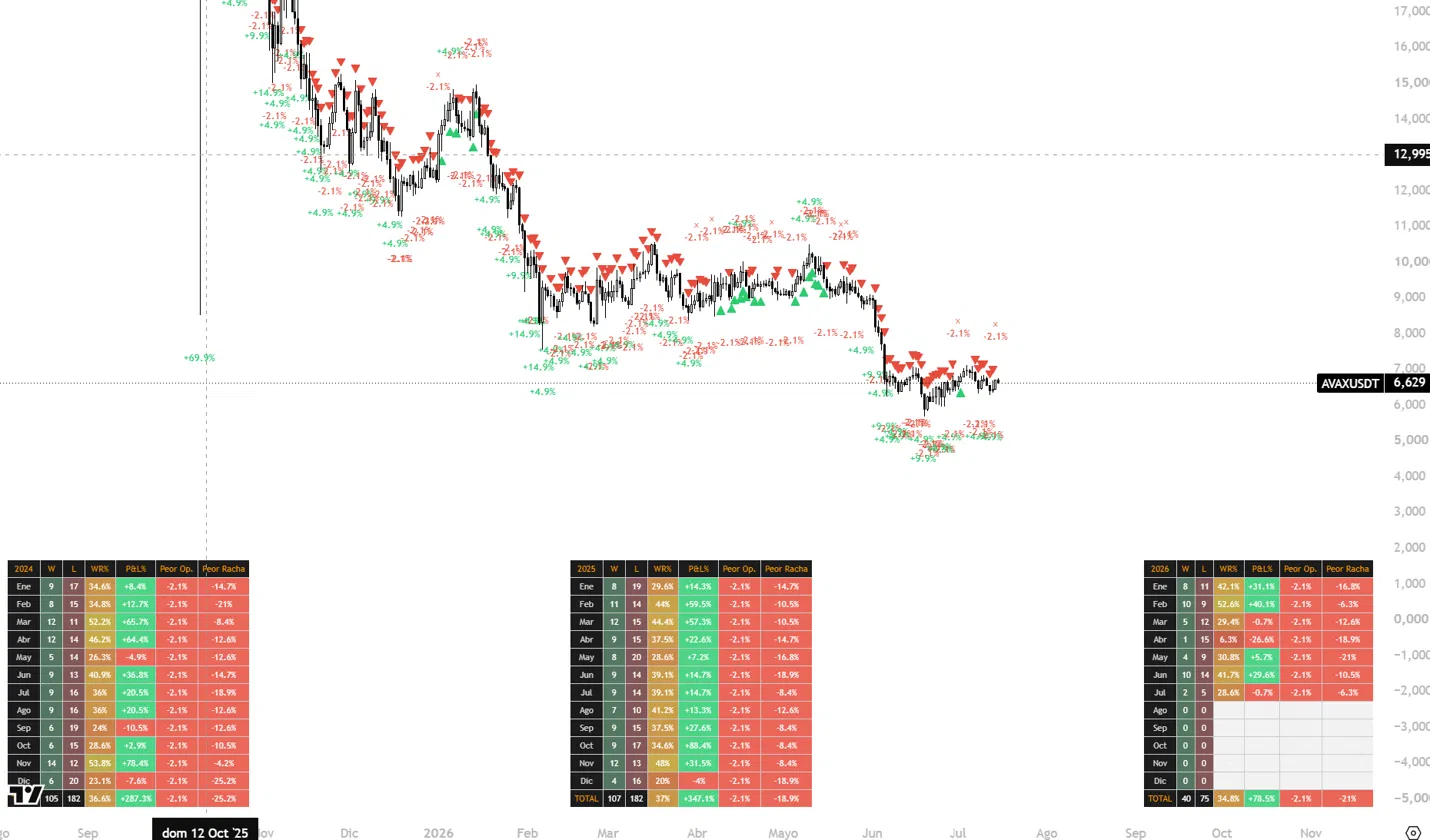
AVAXUSDT · TradingView indicator screenshot · click to enlarge
| Year | Trades | W − L | Win rate | Cum. P&L | Worst streak |
|---|---|---|---|---|---|
| 2024 | 287 | 105 − 182 | 36.6% | +287.3% | −25.2% |
| 2025 | 289 | 107 − 182 | 37.0% | +347.1% | −18.9% |
| 2026* | 115 | 40 − 75 | 34.8% | +78.5% | −21.0% |
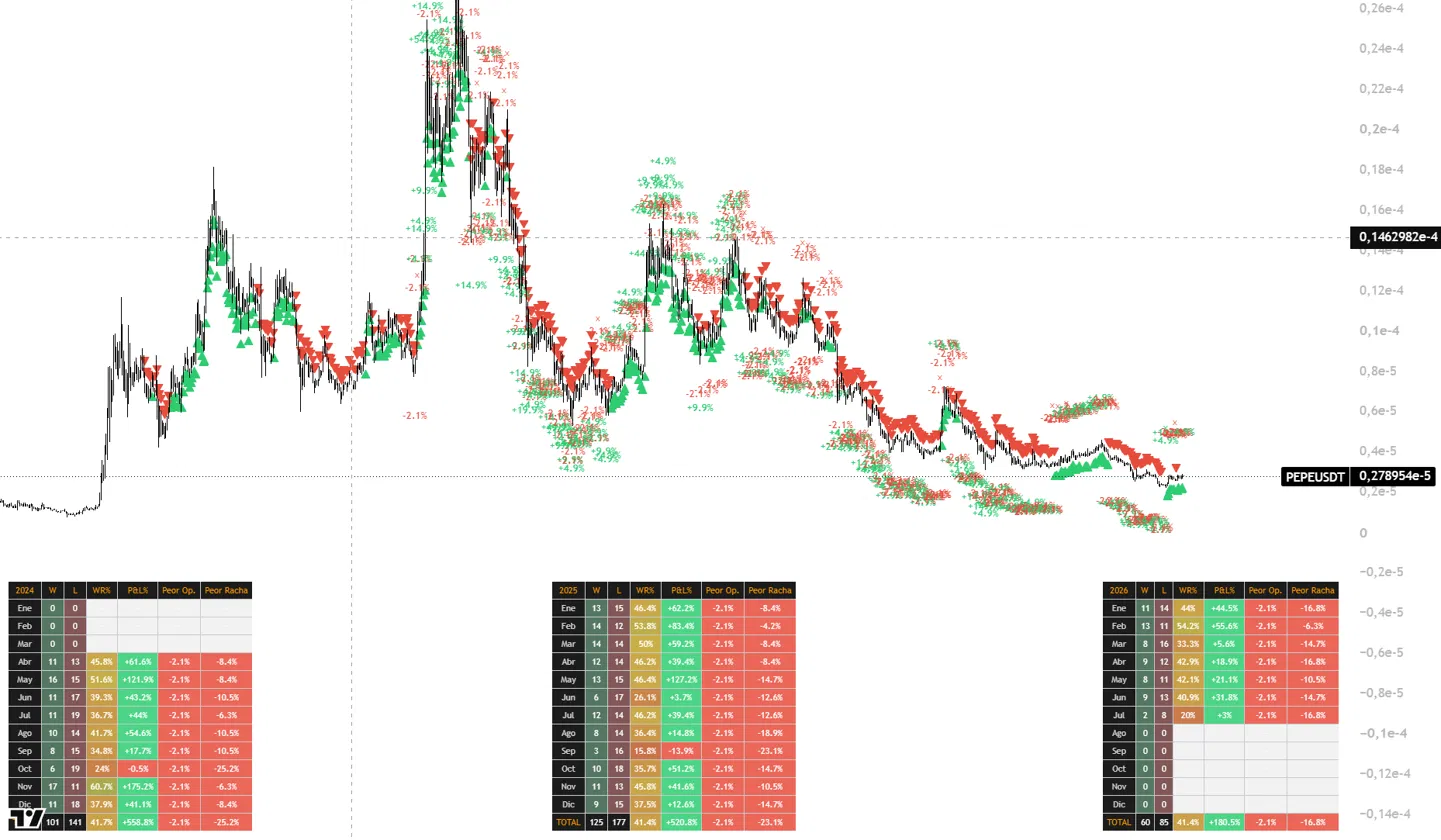
PEPEUSDT · TradingView indicator screenshot · click to enlarge
| Year | Trades | W − L | Win rate | Cum. P&L | Worst streak |
|---|---|---|---|---|---|
| 2024‡ | 242 | 101 − 141 | 41.7% | +558.8% | −25.2% |
| 2025 | 302 | 125 − 177 | 41.4% | +520.8% | −23.1% |
| 2026* | 145 | 60 − 85 | 41.4% | +180.5% | −16.8% |
‡ Track record since April 2024.
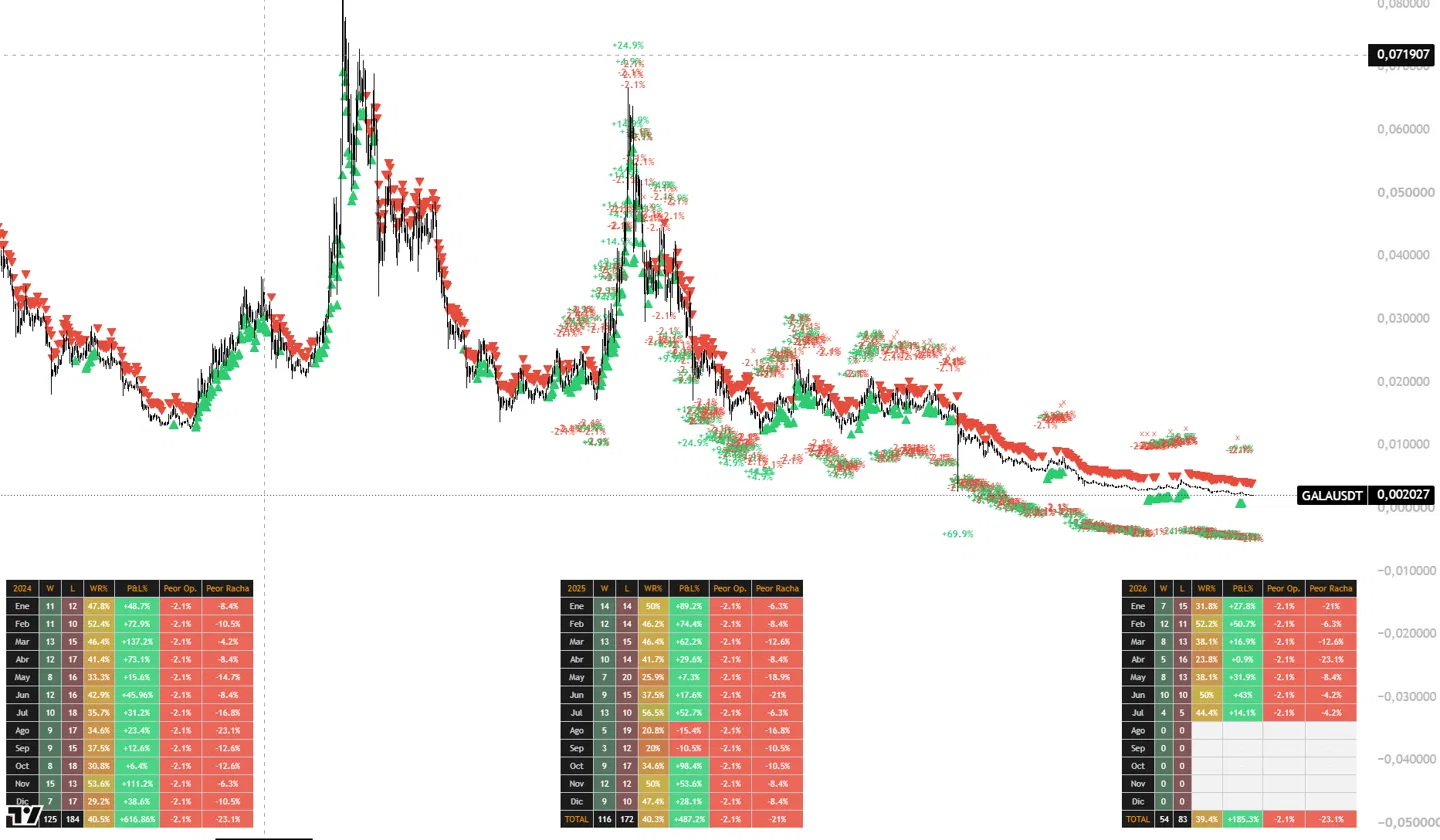
GALAUSDT · TradingView indicator screenshot · click to enlarge
| Year | Trades | W − L | Win rate | Cum. P&L | Worst streak |
|---|---|---|---|---|---|
| 2024 | 309 | 125 − 184 | 40.5% | +616.9% | −23.1% |
| 2025 | 288 | 116 − 172 | 40.3% | +487.2% | −21.0% |
| 2026* | 137 | 54 − 83 | 39.4% | +185.3% | −23.1% |
WR% = share of winning trades · Cum. P&L = simple sum of each trade's percentage · Worst streak = worst consecutive losing run of the period · *2026 in progress (data through July).
Why trust us
We do not ask for faith — we ask you to check the data. These are the rules that separate us from signal pages that only ever show green.
Historical numbers come from the indicator applied to past data. We never present them as live executions, because they are not.
April 2026 closed at −21% on FETUSDT. It is in the table. A service that only shows winning months is editing reality.
Every signal is born with its maximum loss defined. The worst possible trade is always the same: no hidden −40% surprises.
The YouTube stream shows the indicator trading in real time on 5-minute candles. Same logic as the daily signals you get on Telegram.
We win less often than we lose — and the year still closes green. Lose small many times, win big a few times: the edge is in the asymmetry, not in predicting the future.
From zero to signal in minutes
From 1 to 20 pairs. Each pair has its own private Telegram channel, carrying only that asset's signals.
BEP-20 (BNB Smart Chain) or ERC-20 (Ethereum), right inside our Telegram bot. Confirmation is on-chain and automatic.
Once payment confirms, the bot sends you a single-use link to each purchased channel. 30-day access, renewable from the same bot.
Monthly subscription · no lock-in
Every subscription includes the same thing: instant daily-candle signals, a private channel per pair, automatic activation. The only difference is how many pairs you follow.
PRICES IN USDT · BEP-20 & ERC-20 NETWORKS · AUTOMATIC ACTIVATION ON PAYMENT CONFIRMATION · 30-DAY SUBSCRIPTION, NO AUTO-RENEWAL
Before you pay, ask
No. Syntax Quant publishes signals generated automatically by a technical indicator, for informational and educational purposes. We do not know your financial situation, and nothing published here is a personalized recommendation. The decision to trade — and its outcome — is always yours.
Backtest: the indicator, under its current rules, applied to historical TradingView data. They include no fees or slippage and are not trades executed with real money. That is precisely why we stream the indicator running live 24/7 — so you can verify its behavior in real time before subscribing.
Because the system is asymmetric. Every trade carries a fixed −2.1% stop, while winners run much further (+4.9%, +9.9%, +14.9% and beyond, as shown on the charts). Losing small many times and winning big a few times produces green years on 35–47% win rates. Distrust anyone promising 90% accuracy.
Via Telegram, in the private channel of each pair you bought. The alert fires automatically from TradingView and lands in the channel within seconds. Timeframe: daily candles — few signals per month, more selective, no noise.
With USDT over BEP-20 (BNB Smart Chain) or ERC-20 (Ethereum), directly in our Telegram bot. Once the transaction confirms on-chain, the bot automatically sends your access links. The whole process takes minutes with no human in the loop.
No. Channel access is immediate and irrevocable, so no refunds are issued once a subscription is activated. You can evaluate the system for free before paying: the full results are on this page and the live stream runs 24/7.
Yes. Each subscription lasts 30 days. When renewing, you freely pick the pairs for the next period within your plan.